As the nation looks ahead to the 2026 midterm elections, health care costs and economic security remain at the forefront of voters’ minds. Amid this political backdrop, newly released data sheds critical light on the immense reach of Medicaid—and the sweeping disruptions it faces under recent federal legislation. Medicaid currently stands as the foundational pillar of the American health care safety net, providing comprehensive medical and long-term care to approximately 81 million individuals across the United States. Primarily serving low-income families, children, seniors, and people with disabilities, the program accounts for nearly one out of every five dollars spent on health care nationwide.
However, the future landscape of this vital program is undergoing a profound transformation. Last year, Congress enacted a major federal budget reconciliation law that introduces sweeping structural and financial changes to Medicaid. Shortly after the legislation was signed into law, the nonpartisan Congressional Budget Office (CBO) released a sobering economic assessment. According to the CBO’s projections, the new law is expected to slash federal Medicaid spending by an estimated $911 billion over the ten-year period from 2025 through 2034. Furthermore, the analysis warns that these steep reductions will significantly swell the ranks of the uninsured, driving up the number of people without health coverage by 10 million in the year 2034 alone.
These monumental reductions in federal financial support are projected to force state legislatures and governors into making exceptionally difficult fiscal choices. States will have to determine how to offset massive losses in federal matching funds. Officials will weigh difficult options, such as enacting severe cuts to Medicaid benefits and provider reimbursement rates, scaling back eligibility, reducing funding for other essential state programs like education and infrastructure, or pursuing broad-based tax increases to maintain baseline services. The ultimate severity and distribution of these impacts will vary dramatically across state lines, falling with particular intensity on states that chose to expand Medicaid eligibility under the Affordable Care Act (ACA).
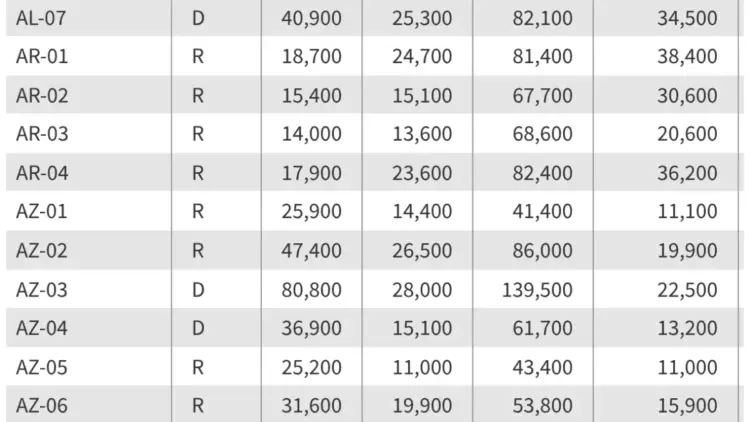
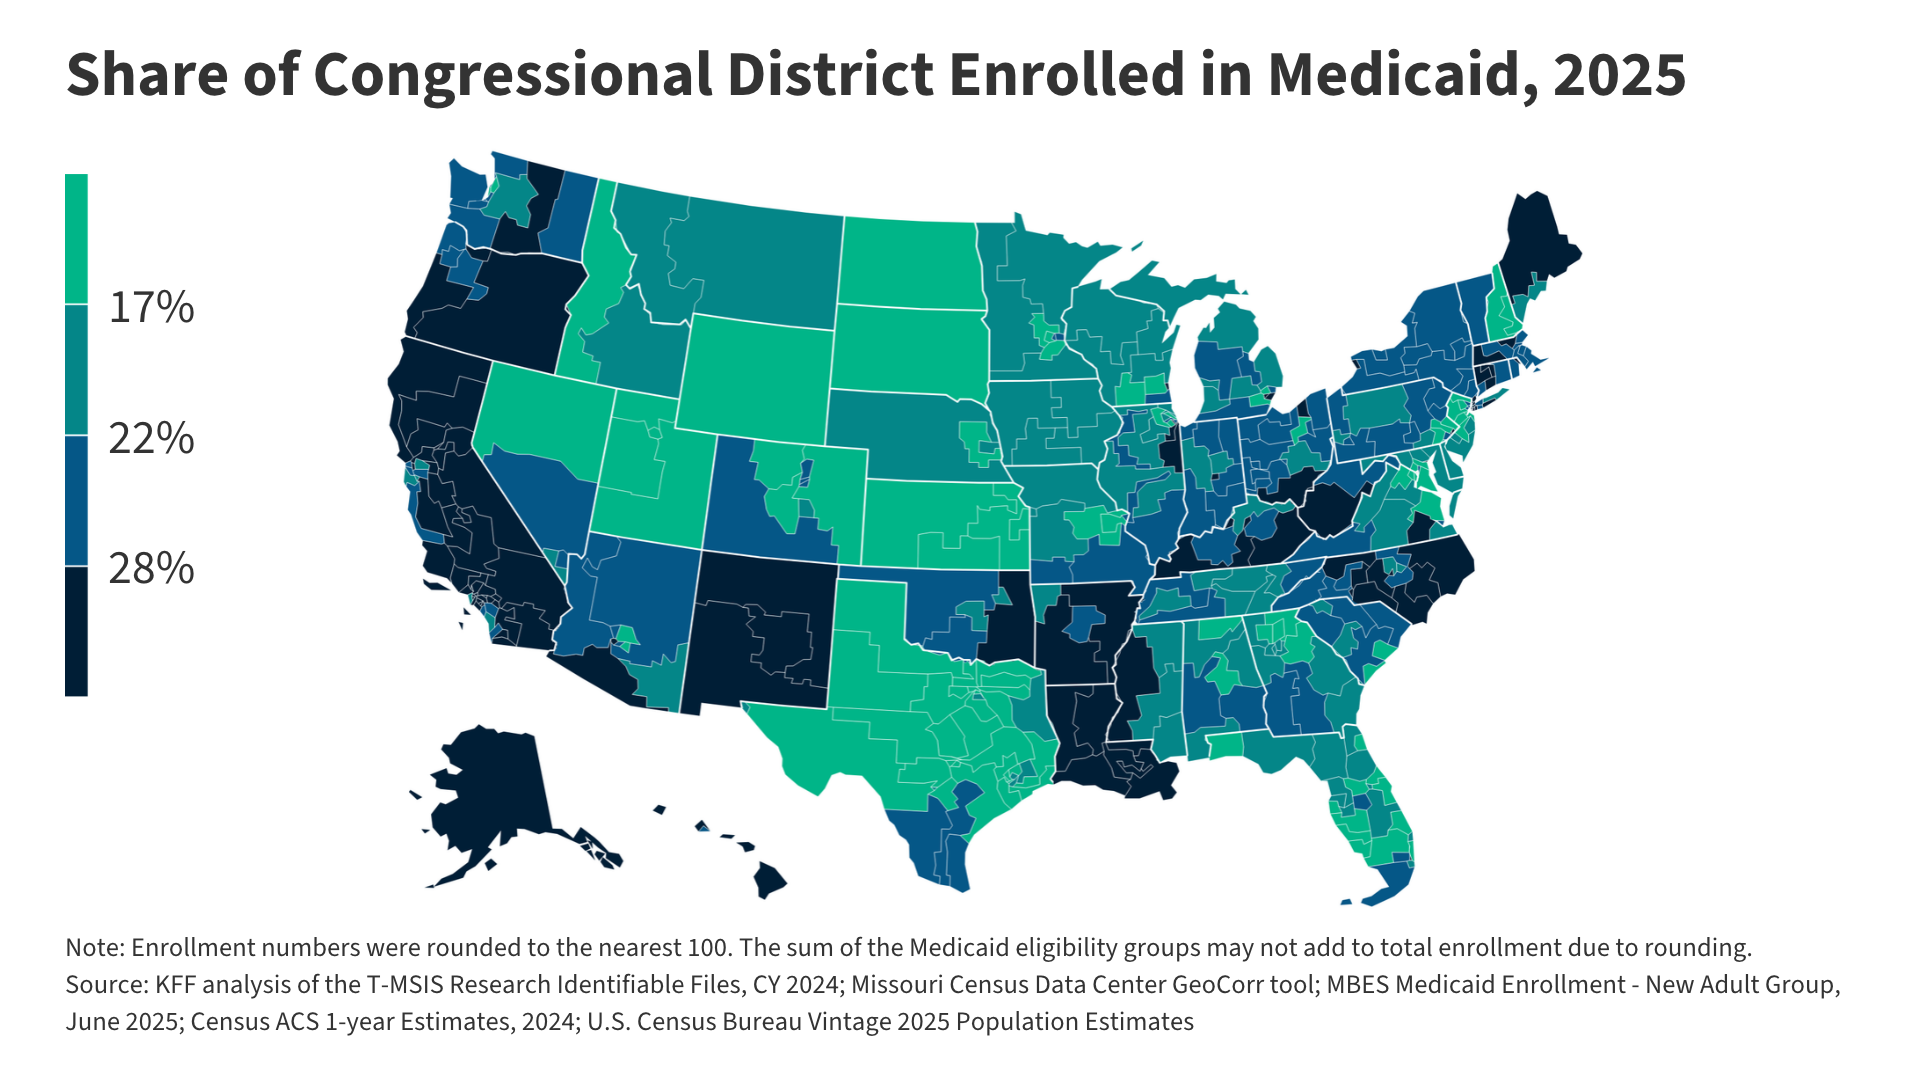
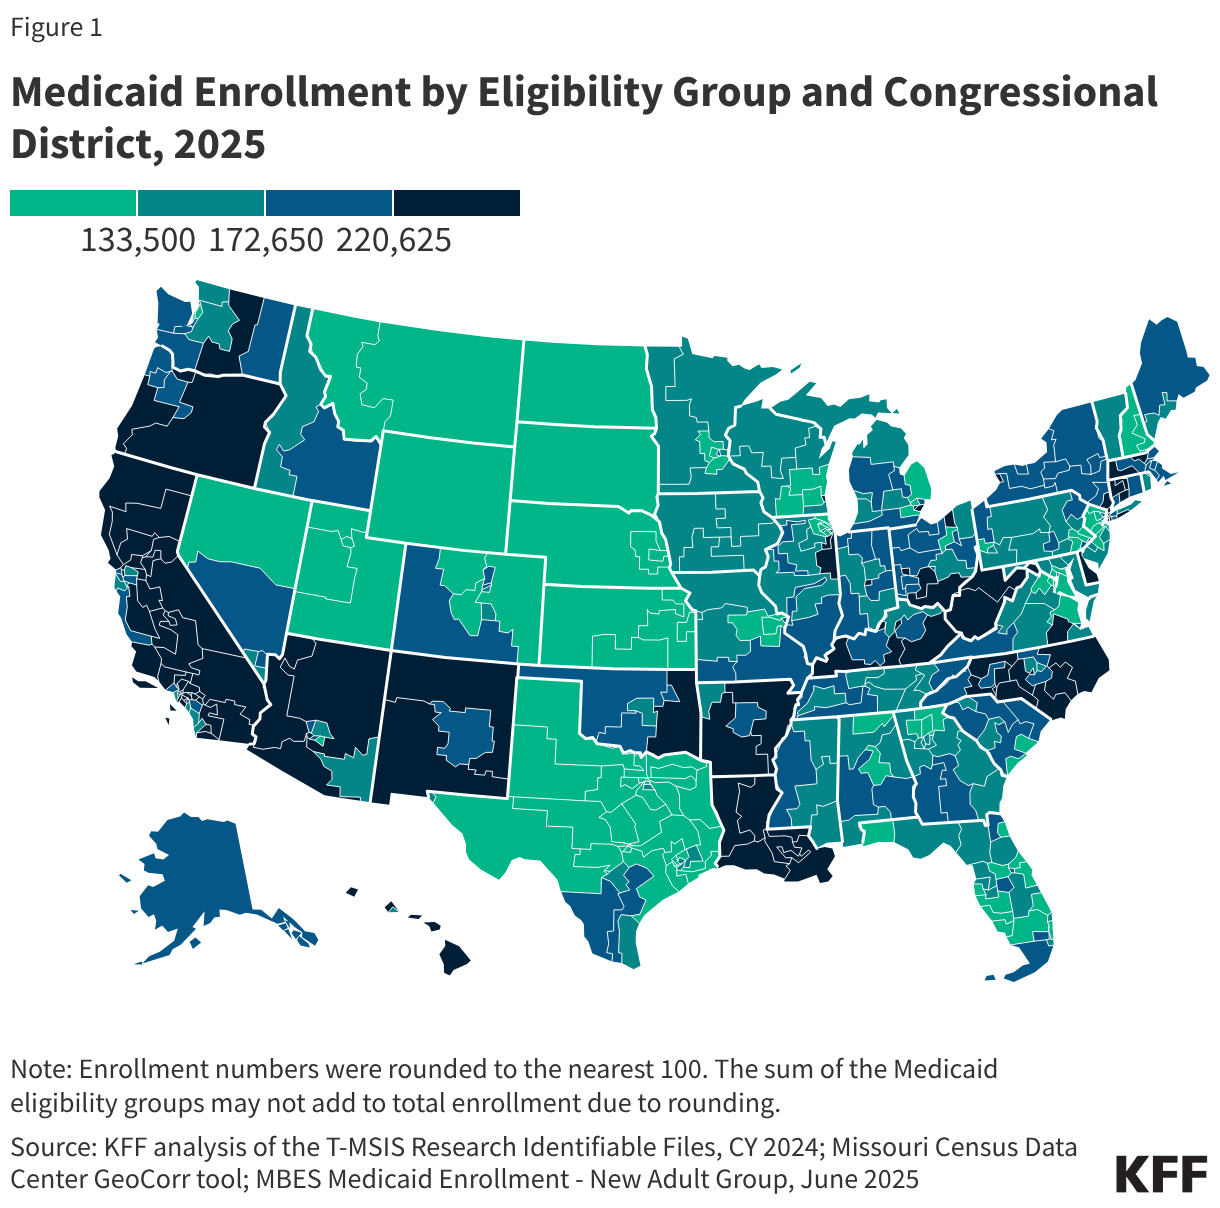
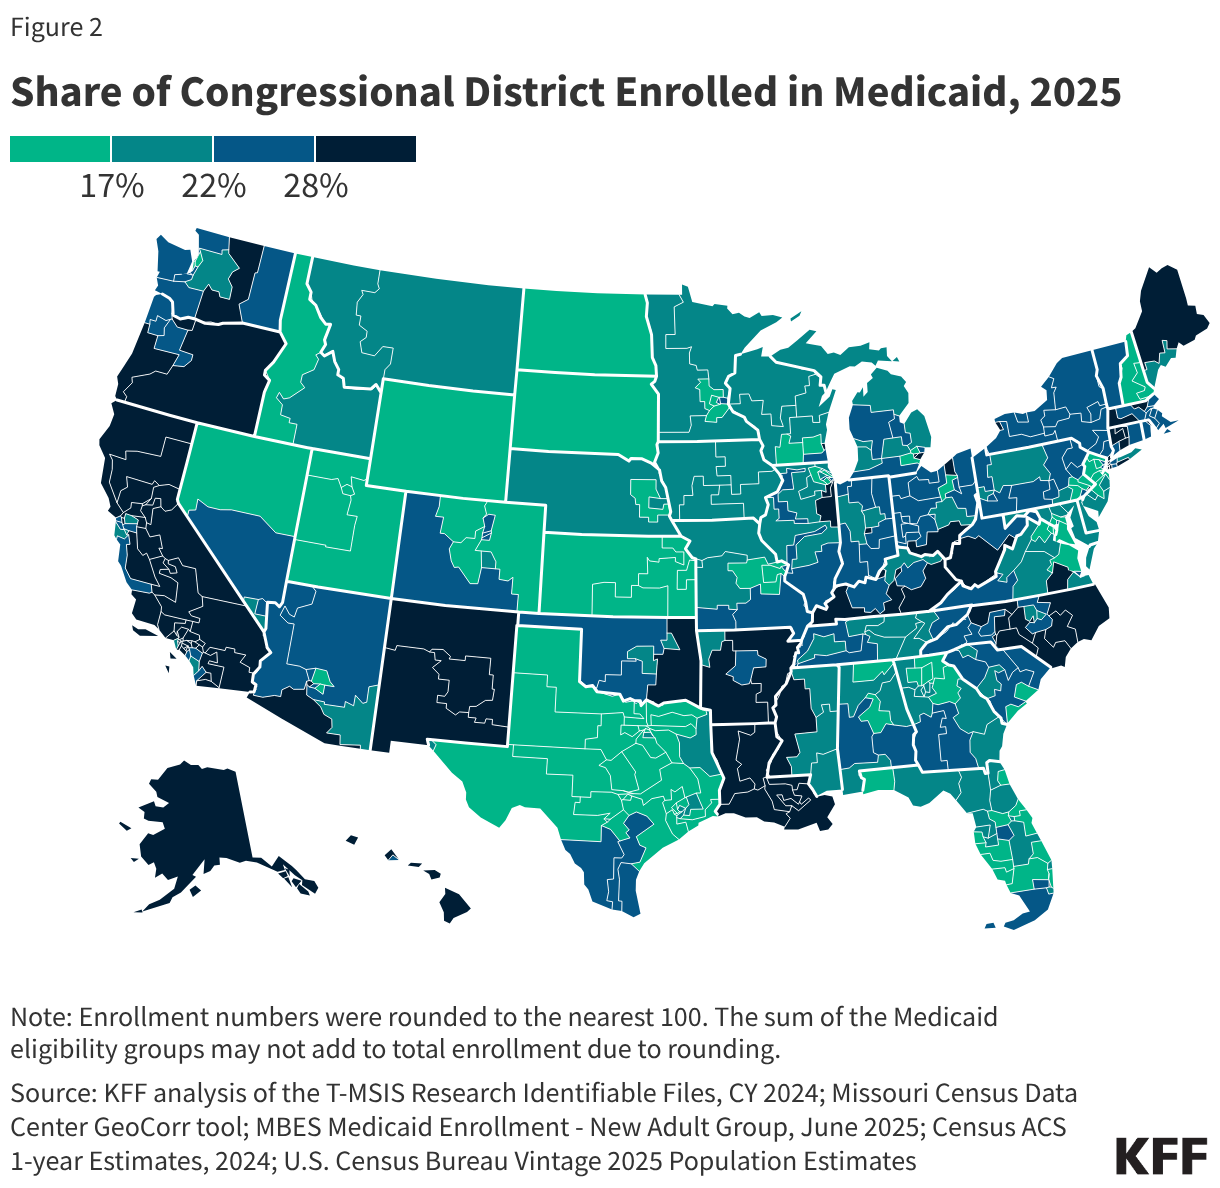
To help policymakers, researchers, and voters understand the localized fallout of these policy shifts, new interactive mapping tools and administrative datasets illustrate the footprint of Medicaid across every congressional district in the country. The comprehensive data captures enrollment numbers for 2025 across major eligibility groups, blending granular administrative data with U.S. Census Bureau population statistics. The findings demonstrate just how deeply embedded Medicaid is within local communities, highlighting the stakes for congressional representatives from both political parties as the 2026 midterm campaigns begin to take shape.
Methods
To establish a clear and accurate picture of Medicaid enrollment down to the congressional district level, the underlying analysis draws upon a robust synthesis of federal administrative datasets and demographic information.
The primary data source for tracking enrollees is the 2024 Transformed Medicaid Statistical Information System (T-MSIS) Research Identifiable Demographic-Eligibility and Claims Files. This information is complemented by the Missouri Census Data Center’s GeoCorr 2022 data, alongside specialized Medicaid new adult group enrollment figures collected through the Medicaid Budget and Expenditure System (MBES) for June 2025. Demographic denominators are derived from the U.S. Census Bureau’s American Community Survey (ACS) 1-Year Estimates for 2024, as well as the Vintage 2025 Population Estimates.
Assigning individual Medicaid enrollees to specific congressional districts required a sophisticated methodological approach. Researchers utilized the Missouri Census Data Center’s GeoCorr tool to construct a dependable zip code-to-congressional district crosswalk. By applying this crosswalk to the T-MSIS records, enrollees were successfully mapped to their respective congressional districts. In instances where a single zip code crossed municipal or district boundaries and was split among multiple congressional districts, enrollees were probabilistically assigned using an allocation factor derived from the 2020 decennial census. These distributions were then applied directly to quarterly MBES administrative enrollment data, which separately tracks adults who gained coverage through the Affordable Care Act alongside all other traditional Medicaid beneficiary categories.
Calculating accurate populations for each congressional district for the year 2025 required a bifurcated methodology, separating states that recently underwent redistricting from those that did not. For states that engaged in redistricting—specifically Alabama, California, Florida, Louisiana, North Carolina, Ohio, Tennessee, Texas, and Utah—researchers leveraged GeoCorr county-to-congressional district population distributions. Because the Census Bureau does not provide localized population estimates at the zip code level, county crosswalks were utilized instead. State population totals from the Census Bureau’s Vintage 2025 estimates were distributed across these geographic allocations and aggregated to establish total populations for each congressional district. For states that did not redistrict, 2024 ACS congressional district figures were used to determine the historical share of the state’s population residing in each district, which were then multiplied against the updated Vintage 2025 state population estimates.
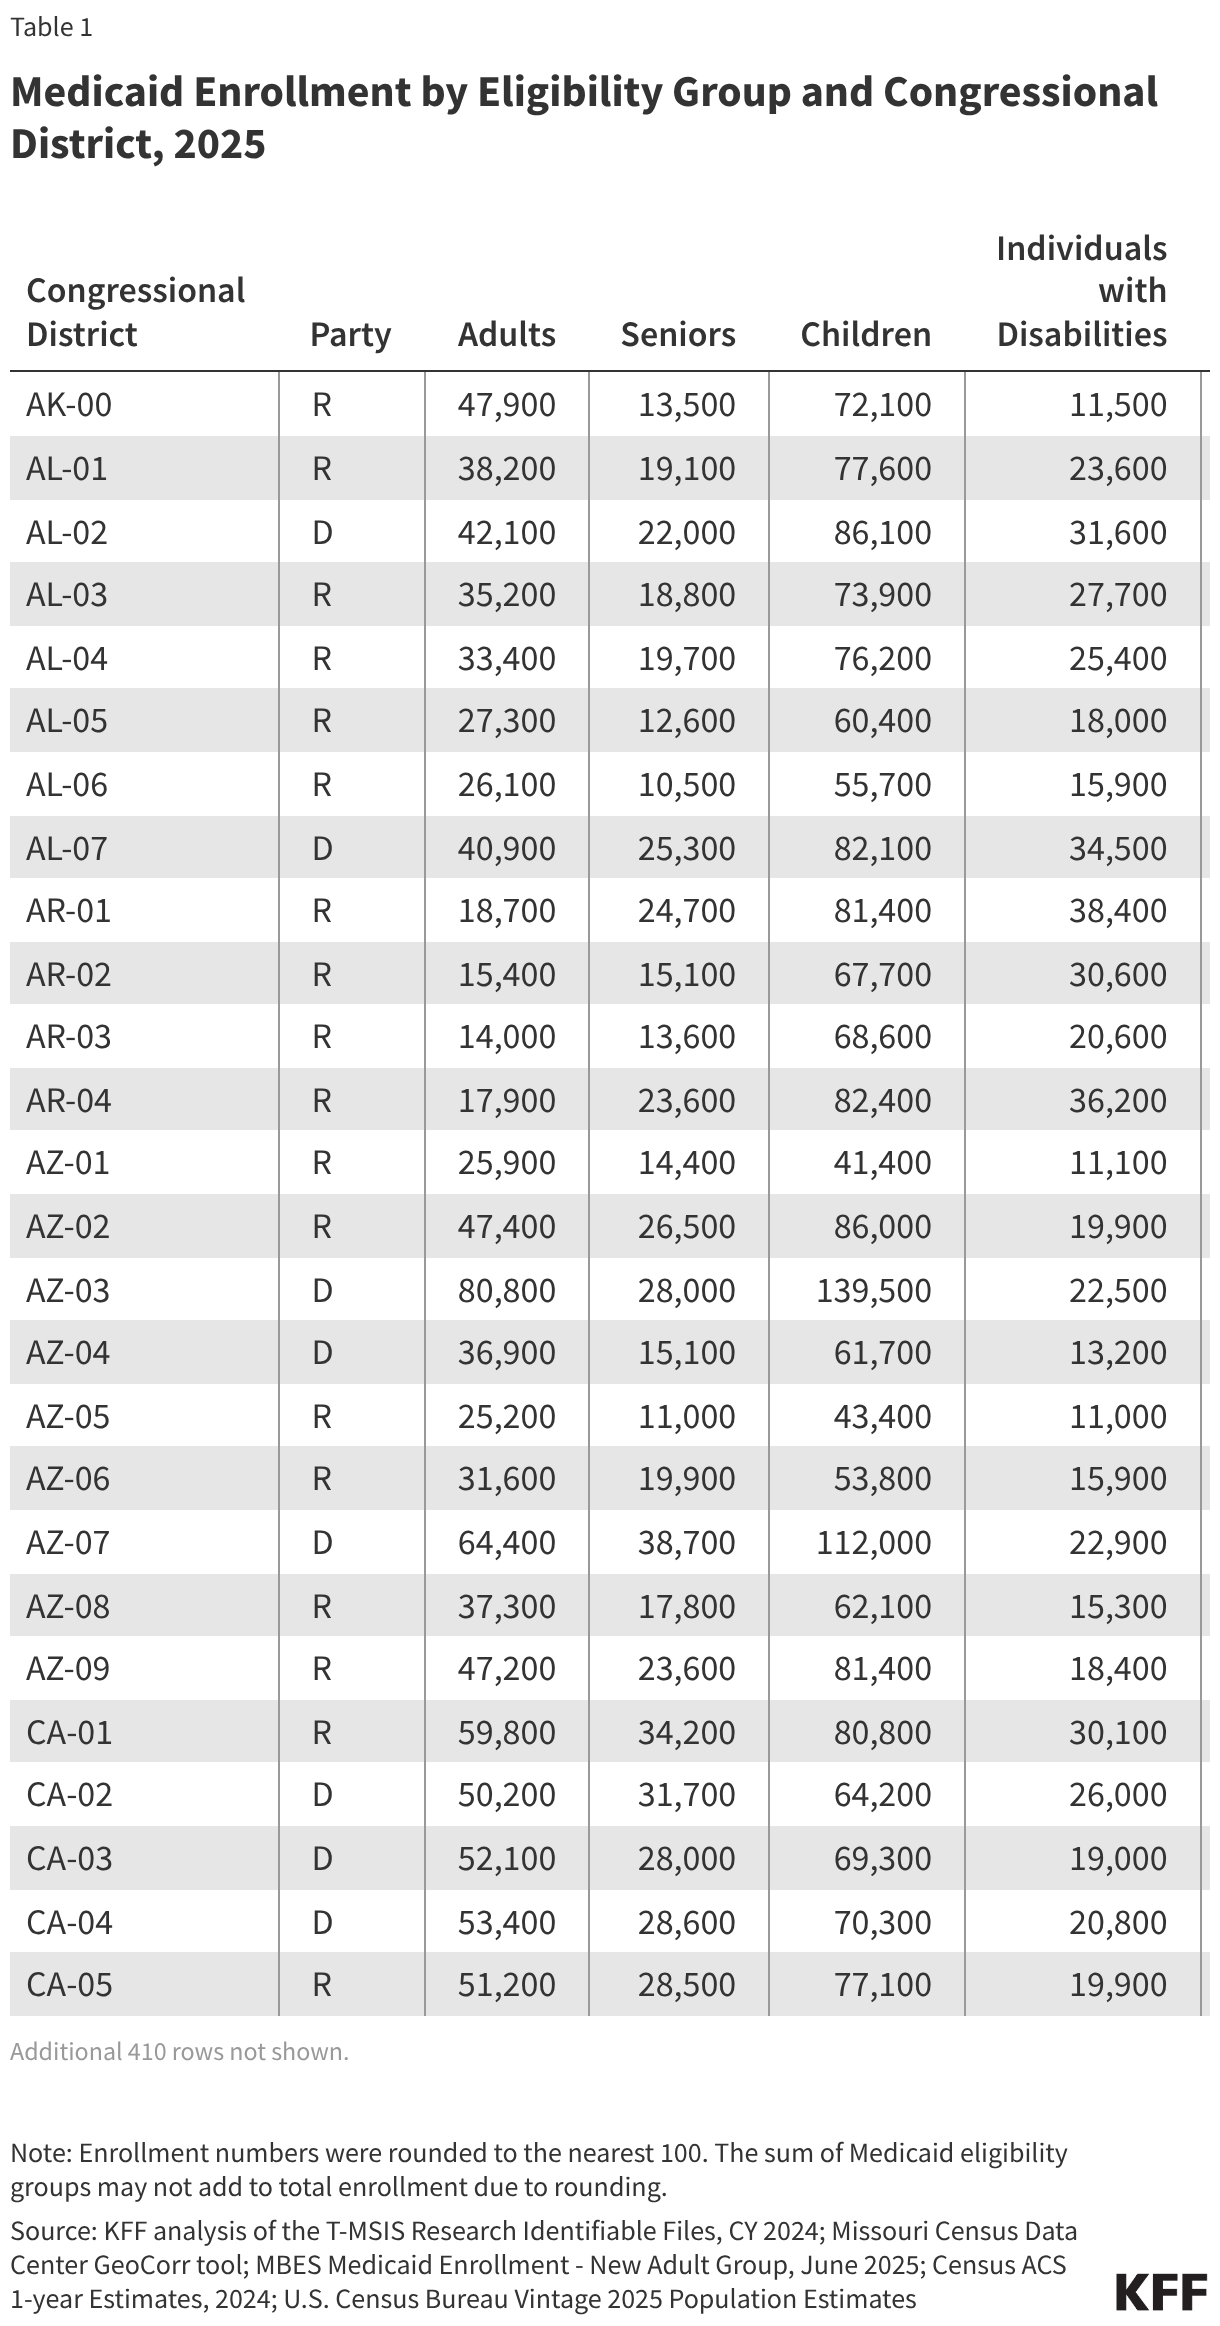
Finally, political party affiliations for each congressional district were assigned based on the party of the currently seated congressional incumbent. For districts with vacant seats during the data compilation period—specifically Florida’s 20th congressional district and Texas’s 23rd congressional district—researchers relied on professional projections from the Cook Political Report, assigning them as Democratic and Republican respectively.
This extensive research forms a vital component of KFF’s ongoing "Health in the 2026 Midterm Elections" series, a comprehensive collection of policy analysis, public opinion polling, and journalistic reporting dedicated to exploring how health care policy and economic pressures will shape the upcoming electoral landscape.