Healthcare policy analysts, researchers, and public health advocates now have access to a newly updated and comprehensive suite of state-by-state data detailing the reach, financing, and demographic breakdown of Medicaid and the Children’s Health Insurance Program (CHIP). These vital public programs provide essential health coverage and long-term care services to millions of low-income children, adults, seniors, and individuals with disabilities across the United States.
Because Medicaid and CHIP are jointly financed by the federal government and individual states—while being administered at the state level within broad federal guidelines—the landscape of public health insurance varies dramatically from one jurisdiction to the next. The newly released collection of state fact sheets aims to illuminate these complex policy choices, demographic differences, and financial variances that shape healthcare access nationwide.
The programs serve as a bedrock for the American social safety net, yet their implementation differs vastly across geographic lines. These discrepancies are largely the result of specific state-level policy decisions, such as whether a state has chosen to adopt the Affordable Care Act (ACA) Medicaid expansion or whether policymakers have opted to set income eligibility limits above federal minimums for specific vulnerable populations. Furthermore, underlying demographic characteristics—including the age distribution, poverty rates, and general health needs of a state’s population—play a major role in shaping enrollment numbers and overall program expenditures.
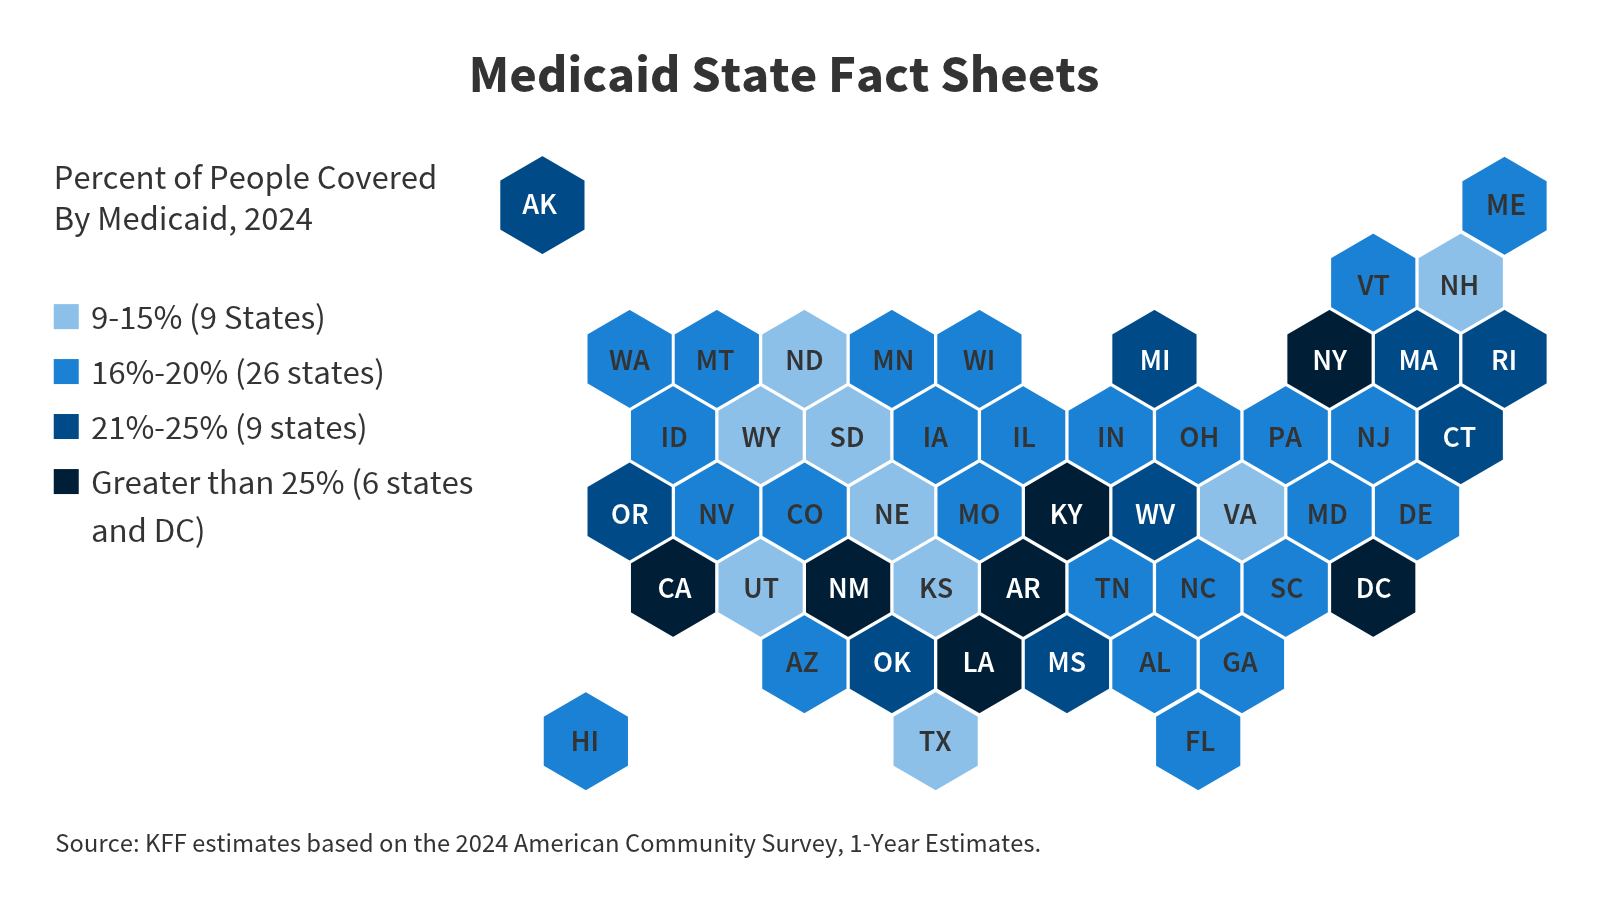
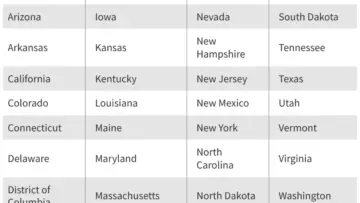
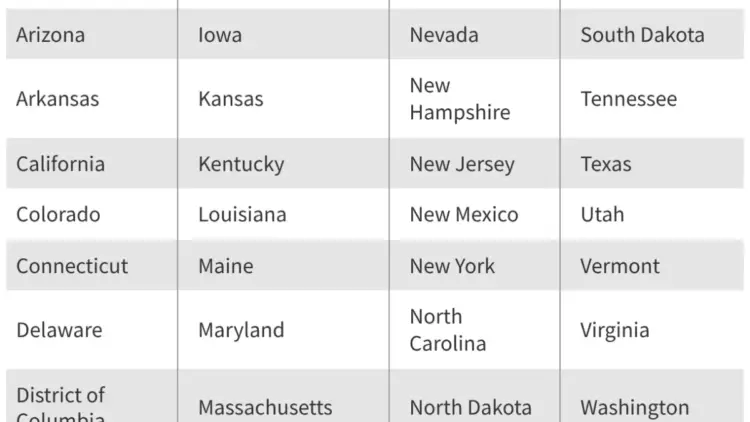
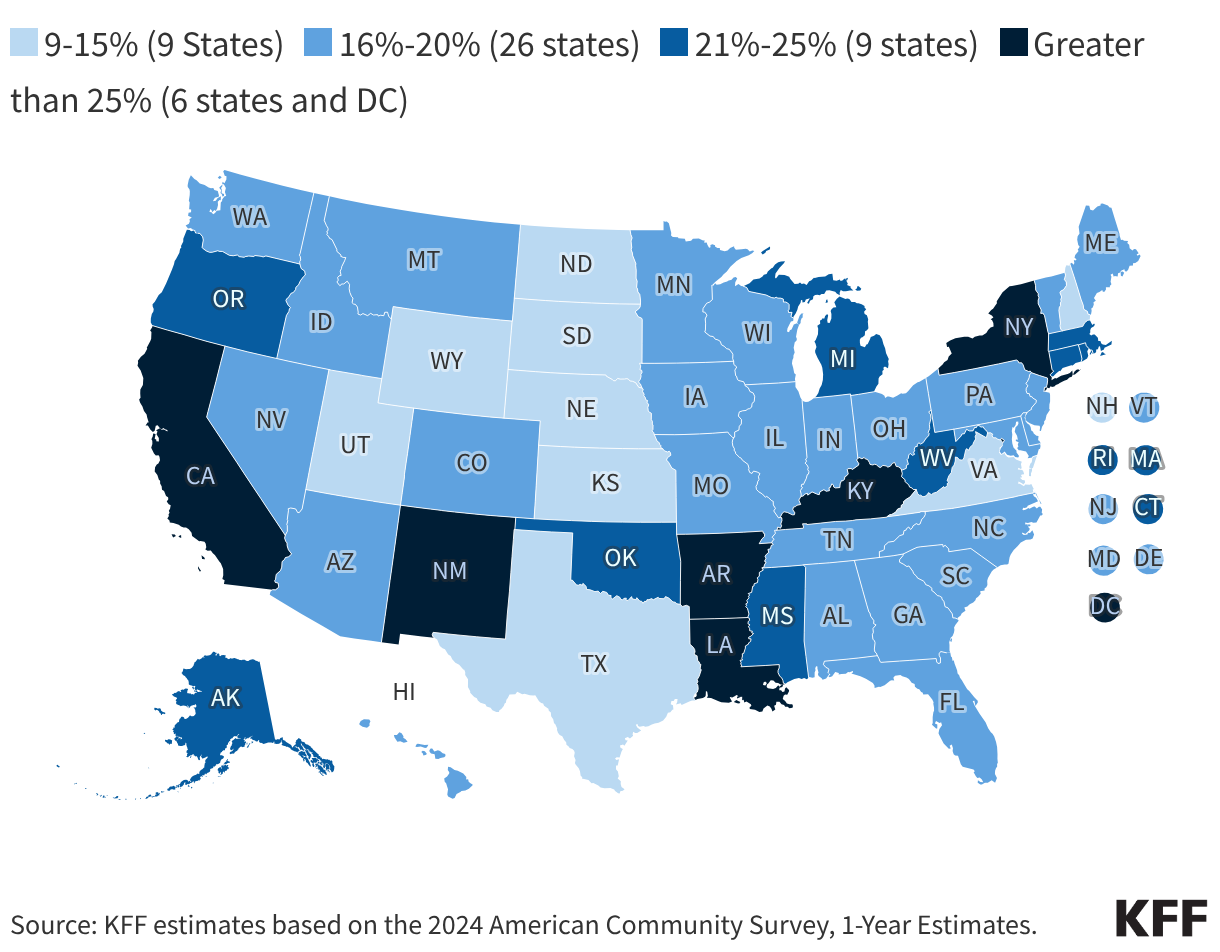
To help policymakers, journalists, and the public navigate this intricate patchwork of healthcare delivery, comprehensive data tools have been made available online. Through interactive choropleth maps illustrating the percentage of people covered by Medicaid in 2024, as well as detailed regional reference tables, stakeholders can easily access customized fact sheets that provide an immediate snapshot of key data for any given state. These resources aggregate critical metrics, offering a clear window into how public health insurance operates at both the state and national levels.
Understanding the mechanics of Medicaid requires looking closely at how these programs are structured and financed. The federal government matches state spending on eligible enrollees according to a formula known as the Federal Medical Assistance Percentage (FMAP), which varies inversely with a state’s per capita income. This means wealthier states receive a lower federal matching rate, while states with lower average incomes receive a higher percentage of federal financial support. Within this shared financing framework, states retain significant flexibility regarding benefit packages, provider payment rates, and delivery systems, leading to a diverse array of managed care and fee-for-service models across the country.
The release of these updated fact sheets arrives at a crucial time for healthcare policy. Program enrollment has experienced significant fluctuations in recent years, influenced by economic shifts, changing policy environments, and the unwinding of continuous enrollment provisions that had kept millions of Americans connected to their health plans during the COVID-19 public health emergency. As states continue to navigate post-pandemic enrollment adjustments, tracking coverage rates, uninsured populations, and eligibility thresholds remains paramount for evaluating the health security of low-income families.
Comprehensive data sources underpinning these state fact sheets draw from extensive research and tracking compiled by organizations such as KFF, a prominent independent health policy research organization. Key metrics incorporated into the reporting framework include total monthly Medicaid and CHIP enrollment figures, historical comparisons dating back to pre-ACA periods, and granular geographical breakdowns such as congressional district maps that detail enrollment by specific eligibility groups. Additional data points encompass total Medicaid enrollees and spending distributions, tracking how financial resources are allocated across various beneficiary categories, including children, adults, seniors, and individuals with disabilities.
Moreover, the fact sheets integrate critical context regarding broader health insurance coverage trends. This includes tracking the ongoing status of state Medicaid expansion decisions, which continue to evolve as remaining non-expansion states reevaluate the fiscal and public health implications of adopting the policy. Uninsured rates for individuals aged zero to sixty-four are also factored into the broader analytical framework, providing a clearer picture of how effectively state safety-net programs are capturing vulnerable populations who might otherwise lack access to necessary medical care.
Demographic characteristics of Medicaid enrollees—ranging from age and race to health status and employment involvement—are woven into the data profiles, alongside median eligibility levels established by state policymakers. By synthesizing these diverse indicators into accessible state-specific summaries, the newly published materials offer an invaluable resource for understanding the ongoing evolution of public health coverage in America.